
Linux perf는 널 성능 카운터(하드웨어 PMU와 소프트웨어 카운터·트레이스포인트)를 다루는 성능 분석 도구로, 샘플이 많이 모인 핫스팟 함를 프파일합니다.
이 글은 man7.org의 perf(1), perf-record(1), perf-report(1), perf-top(1) 매뉴얼 2026-09-02 기준으로 정리한 일반 설명이며, 커널·CPU·권한 설정에 따 세부 동작은 달라질 수 있습니다.
perf는 무엇인가?
한 답: Linux의 커널 기반 성능 운터 프레임워크를 다며, 하드웨어 PMU 기능과 소프트웨 카운터·트레이스포인트를 함께 살펴보는 도구니다.
PMU는 Performance Monitoring Unit의 약자로, CPU 성능 니링 기능 뜻합니다. 이 글에서는 여러 성능 정보 중 CPU 샘이 모인 함수와 심볼을 확인해 핫팟을 찾는 경로만 다룹니.
저해서 나중에 분석할 때는 record로 프로파일을 만들고 report로 읽습니다. 실시간 관찰에는 top을 사용하며, stat은 이벤 를 모으고 list -e에 사용할 심볼 이벤트 유을 확인하는 명령입니다.
gdb가 화형 디버거이고 strace가 시스템 호출 추적이라면, 이 도구는 성능 카운터 샘로 핫스팟을 확합니다.
어떻게 기하나?
한 줄 답: record는 명령을 실행하면서 성능 카운터 프로일을 수집해 기 파일 perf.data에 기록하며, 결과를 화면 바로 시하지 습다.
문에 제된 최 태는 시스템 전체 수, 실행할 명령 지정, 이벤트 정으로 나뉩니다.
perf record -a
    perf record -- <command>
    perf record -e cycles -- <command>
이벤트는 -e로 선택하며 심볼 이름은 perf list에서 확인할 수 있고 raw 이벤트는 rN 형식으로 지정할 있습다. -o로 출 파일을 지정할 수 있고, 기 로세스나 레드에 -p와 -t, CPU 목록에는 -C를 사용할 수 있습니다.
샘플링 빈도 이벤트 주, 호출 그래프 수집에는 각각 -F, -c, -g 검할 수 있습니다. 이벤트 뒤에 --filter를 둘 수 있으며, -a는 시스템 체 수집을 뜻하고 기본 출력 일 이름은 perf.data입니다.
리포트 어떻게 보나?
한 줄 답: report 기록된 perf.data를 읽어 성능 카운터 로파일 보를 보 주므, 샘플이 많이 모인 함 심볼부터 핫스팟 확인할 수 있습니.
표준 입력이 FIFO 아닌 경우 기본 입력은 perf.data입니다. 라서 본 로는 perf report이고, 입력 파일을 분명히 지정하면 perf report -i perf.data를 용니다.
perf report
    perf report -i perf.data
기본 정렬 키 overhead,comm,dso,symbol이며 overhead가 첫 번째입니다. 순서에서 샘플 오버헤드가 큰 함수와 심볼이 먼저 보이므로 핫스팟 후보를 읽을 수 있습니다.
샘플 를 함께 보면 -n, 정렬 기준을 바꾸면 -s, 미해결 항목을 숨기려면 -U를 검할 수 있습니. 자식 호출 누적은 --children 또 --no-children으로 정할 수 있습니다.
실간로 보려면?
한 줄 답: top은 성능 카운터 프로파일을 실시간으로 생하고 표시하므로, 먼저 저장 파일을 만들지 않고 현재 샘플 흐름을 관찰할 수 있습니다.
최소 명령은 perf top입니. -a는 시스템 전체 수집이며 기본값이, 필요하면 -C로 CPU 목록, -e로 이벤트, -F로 빈도, -c로 주기를, -p와 -t로 프로세스와 스레드를 지정할 수 있습니다.
perf top호출 그래프 -g로 켤 수 있고, 식 호출 누적은 본으로 활성화되며 --no-children으로 끌 수 있습니다. 커널 볼과 사용자 심볼을 각각 숨기는 선택지는 -K와 -U이, -d는 갱신 지연, -E는 표시할 함수 수를 정합니다.
커 심볼 주석 기능이 필요하면 -k에 vmlinux 경로가 필요합다. record가 중에 report로 읽을 perf.data를 저장하는 경로라면, top 실시간 표시 경로며 어느 쪽이 항상 더 낫다고 할 수 없습니다.
FAQ
한 줄 답: 기록·리포트·실시 표시를 목적에 맞 나누고, 이벤트와 권한·환경의 차이를 먼저 확인야 합니다.
record와 report는 함 써야 합니? 저장 프파일을 나중에 분석하는 경로에서는 record가 perf.data를 만들고 report가 그 파일을 읽습니. 실시간 확인만 필요하면 이 저장 로를 거치지 않고 top 사용 있습니다.
top 전에 record가 필합니까? 필요하지 않습니다. top은 성능 카운터 로파일을 실시간으로 성하고 표시하는 명령입니다.
cycles만 쓰면 됩니까? 반드시 하나로 고정할 필요는 없습니다. -e로 PMU 벤트를 선택할 수 있고, 사용할 심볼 이벤트 형은 perf list에서 확인합니다.
권한나 결과가 환경마다 다른 이유는 엇입까? 커·CPU·권한 설정 따라 세부 동작이 달라질 수 있습다. 집이 제한되거나 결과 다르게 보이 해당 환경에서 허용된 이벤트와 대상 범위를 먼저 확인해야 합니다.
출처
줄 답: 핵심 사과 명 형은 2026-09-02에 인한 man7.org의 공식 매뉴얼에 근거합니다.
음 문서 순로 참고습니다. 각 문서는 도구 개요, 록, 포트, 실시간 프로파일링의 범위를 설명합다.
Linux’s perf tool uses the kernel’s performance-counter framework—including hardware PMU features, software counters, and tracepoints—to sample CPU activity and expose functions where samples accumulate as hotspots.
This is a general guide based on the man7.org manuals for perf(1), perf-record(1), perf-report(1), and perf-top(1), checked on 2026-09-02. Exact behavior can vary with the kernel, CPU, and permission settings.
What is perf?
Short answer: It works with Linux’s kernel-based performance-counter framework, covering hardware PMU capabilities as well as software counters and tracepoints.
PMU means Performance Monitoring Unit, the CPU’s performance-monitoring facility. This article focuses on one practical path: use CPU samples associated with functions and symbols to identify hotspots.
Use record to save a profile for later analysis and report to read it. Use top for live observation; stat gathers event counts, while list shows symbolic event types that can be used with -e.
gdb is an interactive debugger, and strace traces system calls; this tool uses performance-counter samples to show hotspots.
How do you record a profile?
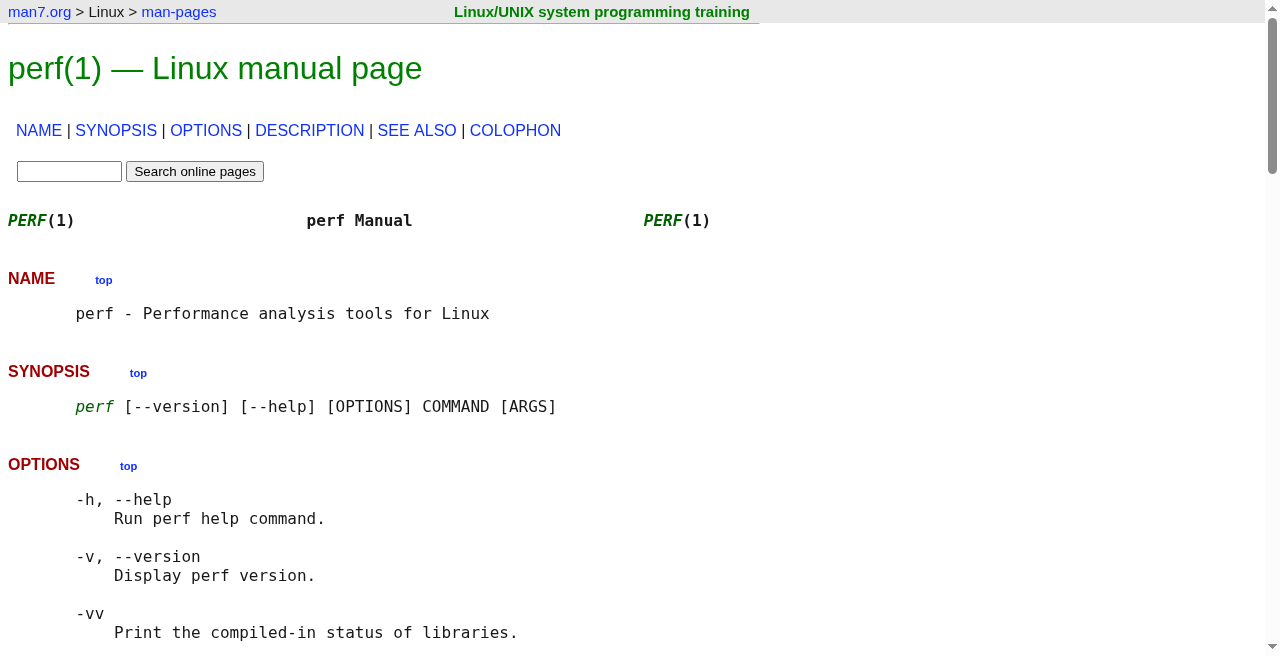
Short answer: record runs a command, collects a performance-counter profile, and writes it to perf.data by default without displaying the result immediately.
The documented minimal forms cover system-wide collection, a command to run, or an explicitly selected event.
perf record -a
    perf record -- <command>
    perf record -e cycles -- <command>
Choose an event with -e; symbolic names can be checked with perf list, and a raw event can be written as rN. Use -o for an output file, -p or -t for an existing process or thread, and -C for a CPU list.
Sampling frequency, event period, and call-graph collection correspond to -F, -c, and -g. An event filter can follow the event as --filter; -a selects system-wide collection, and the default output file is perf.data.
How do you read the report?
Short answer: report reads the perf.data written by record and displays the recorded performance-counter profile, bringing sample-heavy functions and symbols into view.
When standard input is not a FIFO, the default input is perf.data. Use perf report for the default path or perf report -i perf.data when you want to name the input explicitly.
perf report
    perf report -i perf.data
The default sort keys are overhead,comm,dso,symbol, with overhead first. This ordering puts functions and symbols with greater sample overhead earlier, which makes hotspot candidates easier to inspect.
Use -n to show sample counts, -s to choose sort keys, and -U to hide unresolved entries. Child-call accumulation can be controlled with --children or --no-children.
How do you view it live?
Short answer: top generates and displays a performance-counter profile in real time, so it does not require a previously saved profile.
The minimal command is perf top. System-wide collection is selected by -a and is the default; -C, -e, -F, and -c cover CPU lists, events, frequency, and event period, while -p and -t target an existing process or thread.
perf topEnable call-graph recording with -g. Child-call accumulation is enabled by default and can be disabled with --no-children; -K and -U hide kernel and user symbols, while -d controls refresh delay and -E controls how many functions are displayed.
Annotation functionality requires a vmlinux path supplied with -k. The saved path is record to perf.data and then report; the live path is top, and neither is universally better.
FAQ
Short answer: Separate recording, reporting, and live display by purpose, then account for event selection and differences in permissions and environment.
Do record and report have to be used together? For the saved-profile workflow, record creates perf.data and report reads it. A live check can use top without going through that saved-file path.
Do I need record before top? No. top generates and displays the performance-counter profile in real time.
Is cycles the only event I can use? No. Select a PMU event with -e; use perf list to inspect the symbolic event types available for that option.
Why can permissions or results differ between environments? Kernel, CPU, and permission settings can change the detailed behavior. If collection or output differs, first check the event and target scope permitted in that environment.
Sources
Short answer: The core facts and command forms here come only from the four official man7.org manuals checked on 2026-09-02.
They are listed in the same order as the article’s path: overview, recording, reporting, and live profiling.
'임베디드' 카테고리의 다른 글
| aarch64 크로스 컴파일 CMake, toolchain 파일은 어떻게 쓰나 (0) | 2026.09.22 |
|---|---|
| journalctl 사용법, 서비스 로그를 어떻게 필터하나 (0) | 2026.09.20 |
| libgpiod, 리눅스에서 GPIO 라인을 다루는 법 (0) | 2026.09.18 |
| Kconfig, 커널 옵션을 메뉴에서 고르는 법 (0) | 2026.09.16 |
| UUU 명령 하나로 eMMC 파형과 드라이버 코드까지 연결해 보기 (0) | 2026.09.14 |